Service 04
Data analytics your team will actually use.
We bring the data scattered across your spreadsheets and apps into one trusted place, then build the dashboards and alerts that help people make better decisions every day.
One source of truth
Most growing businesses have plenty of data and little clarity. Sales numbers live in the CRM, finance in accounting software and operations in spreadsheets, and too many meetings start with an argument about whose figures are right.
The fix is a single, trusted source of truth: a pipeline that collects information from each system automatically, cleans it and stores it in one place, so every report draws on the same numbers. Once that foundation exists, questions that used to take a week of spreadsheet work can be answered in minutes.
What we build
Every analytics project has the same layers, and we build each one to last:
- Data pipelines that pull from your apps, databases and files on a schedule or in real time.
- A data warehouse, such as BigQuery or Snowflake, that stores clean, joined-up history.
- Executive and team dashboards that show the numbers each role needs, and nothing more.
- Anomaly alerts that flag unusual spikes or drops as they happen, instead of in next month's report.
- Forecasts built on your own history, for demand, revenue or capacity planning.
Dashboards designed around decisions
A dashboard is only useful if it changes what someone does. We start by asking which decisions each team makes and which numbers would make those decisions better, then design views around them. A sales manager might need pipeline by stage and rep activity; an operations lead needs backlog, turnaround times and bottlenecks.
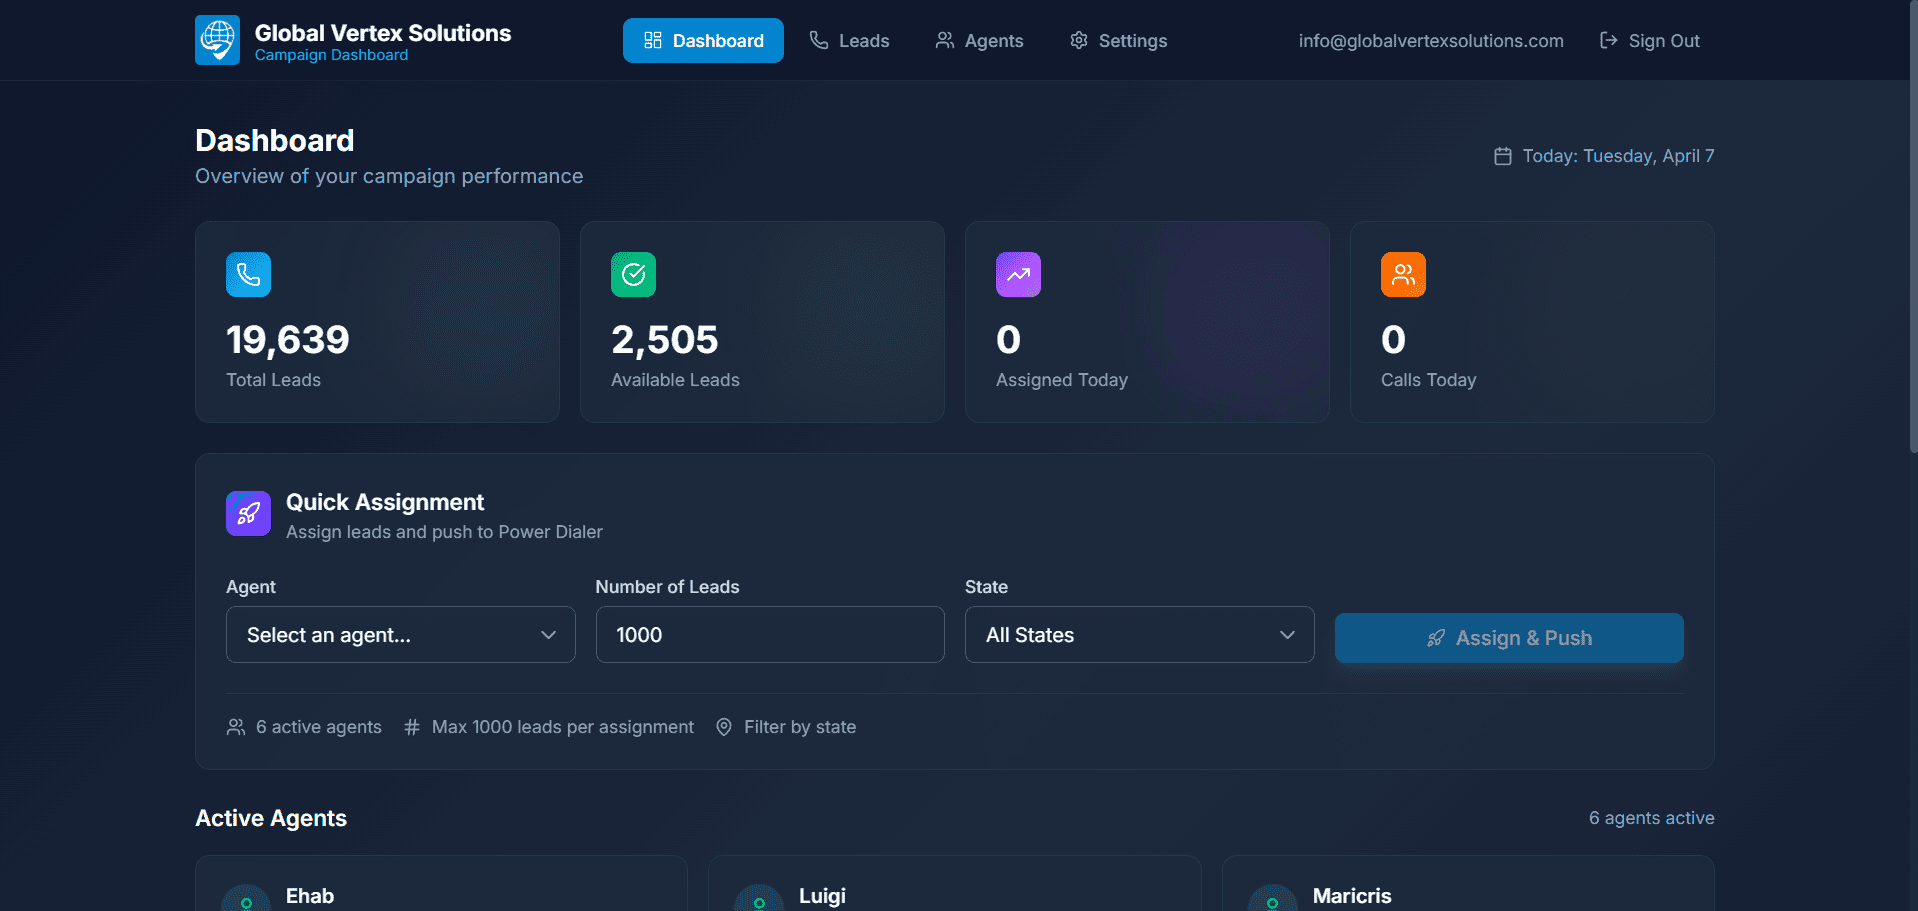
Good dashboards also live where the work happens. The CRM we built for Global Vertex Solutions puts pipeline visuals in front of its directors, so they can spot friction as it appears rather than at the end of the quarter.
We keep dashboards deliberately small. A page with six numbers that someone checks every morning beats a wall of forty charts that nobody reads, and alerts cover the rest by speaking up only when something needs attention.
Data quality you can trust
Numbers people do not trust are worse than no numbers. We build validation into every pipeline, with checks for missing, duplicated and out-of-range values, and we document where every figure comes from and how it is calculated. When a number looks wrong, anyone can trace it back to its source. Pipelines are monitored like any production system, so a broken source is noticed and fixed before the Monday meeting.
Access is limited by role, so sensitive data such as salaries or customer details is seen only by the people who need it. Personal data is handled around your compliance requirements, including GDPR for European customers.
How a project runs
We begin with the questions leadership asks most often and the reports people rebuild by hand every week. From those we define the metrics, agree each definition with the teams involved, and connect only the sources needed to answer them. The first dashboard ships within weeks rather than months.
After that, each iteration adds sources and views based on what people actually use. Usage tells us which dashboards earn their place, and the ones nobody opens are retired rather than maintained forever.
Starting from spreadsheets
You do not need a data team to begin. Many projects start by replacing a handful of critical spreadsheets with an automated pipeline and a single dashboard, then grow from there as confidence and questions increase. The spreadsheets that people genuinely like working in can stay, fed with fresh numbers from the pipeline instead of manual copy and paste.
Analytics pairs naturally with process automation, which keeps the data flowing, and with cloud architecture that scales as the volume grows. Show us the report you dread building.
Case studies
Data Analytics, in practice.
FAQ
Frequently asked questions.
Common questions about our Data Analytics service.
No, that is the usual starting point. We connect to each source through APIs, exports or database access, then clean and combine the data in one place. Part of the work is agreeing which system is the source of truth for each number.
We work with the tool that suits your team, from established BI platforms to dashboards built into your own software. The data layer underneath matters most, and we design it so you can change dashboard tools later without starting over.
As fresh as the decisions need. Many business reports are fine refreshed hourly or daily, while operations and alerting benefit from real-time streams. We match freshness to each use, because real time everywhere costs more than it returns. Every dashboard shows when its data was last refreshed, so nobody acts on stale numbers by mistake.
Every pipeline includes automated checks for missing, duplicated and out-of-range data, and every metric has a written definition and a traceable source. When a number looks wrong, you can see exactly where it came from. Pipelines are monitored, so a broken source raises an alert instead of quietly producing wrong figures.
Yes, when there is enough history to learn from. We start simple, with trends and seasonality, and move to machine learning only where it measurably improves accuracy. Forecasts come with ranges, not just single numbers, so they support real planning.
Still have a question? Email us
More services
Everything else we build.
- 01 AI Integration Foundation models and ML pipelines built into the tools you already use.
- 02 Custom Platforms Web, mobile and SaaS products shaped around how your business works.
- 03 Process Automation Workflows that run themselves across your existing software.
- 05 System Architecture Cloud infrastructure that stays fast and available as you grow.
Let’s talk
Have a project in mind?
Tell us what you’re building. The first consultation is free.
Prefer email?info@b2xgroup.com